

Read the room usage report
The booking analytics pivot table. The user resource usage report crosses any two dimensions — who booked against what they booked, month by month. How to build the grid by dragging, what the hours actually count, and why the download is wider than the screen.
User resource usage answers one shape of question: who used what, and for how long. It is the pivot table for bookings: a grid you build yourself — put anything down the side, anything across the top, and read hours and bookings where they cross.
Find it under Booking › Analytics › User resource usage.
Open User resource usage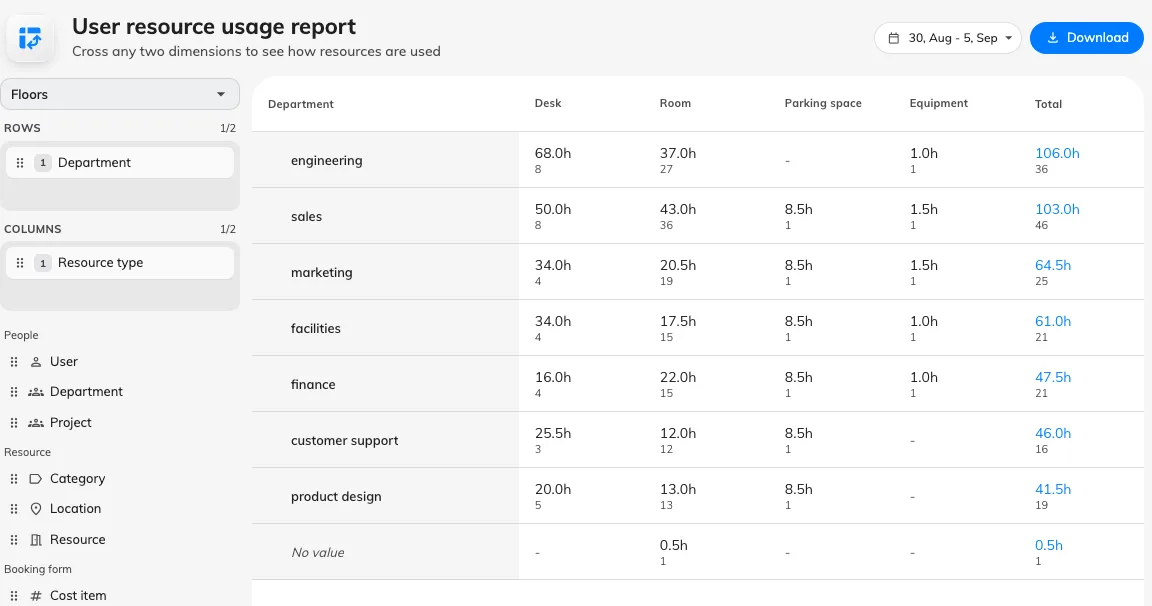
Departments down the side, resource types across the top.
What the numbers mean
Read this before quoting a figure to anybody, because the definition is narrower than “how busy the room was”:
Usage is the booked length of each resource booking — start to end as scheduled — credited to whoever organised it. Checking in does not change the figure, and neither does leaving early or never turning up at all.
Which means:
- Bookings that were cancelled, rejected or marked as a no-show are not counted. A booking that becomes a no-show has its usage removed, so the same room can show fewer hours this week than it did last week.
- A booking waiting for approval only counts where the approval holds the time. Where approval does not block the slot, it counts once approved.
- A booking of two rooms counts as two, and a weekly repeat counts once per occurrence, because a row is one resource on one occurrence.
- Hours are credited to the organizer, not shared among attendees.
- A booking that straddles the start or end of the period is counted whole. Nothing is clipped to the period, and nothing is clipped to business hours.
This is a booking report, not an occupancy report. For whether anybody was actually in the room, that is the sensors’ story rather than this one.
Build the grid
There is no Apply button and no wizard. Drag a field into Rows or Columns and the grid redraws.
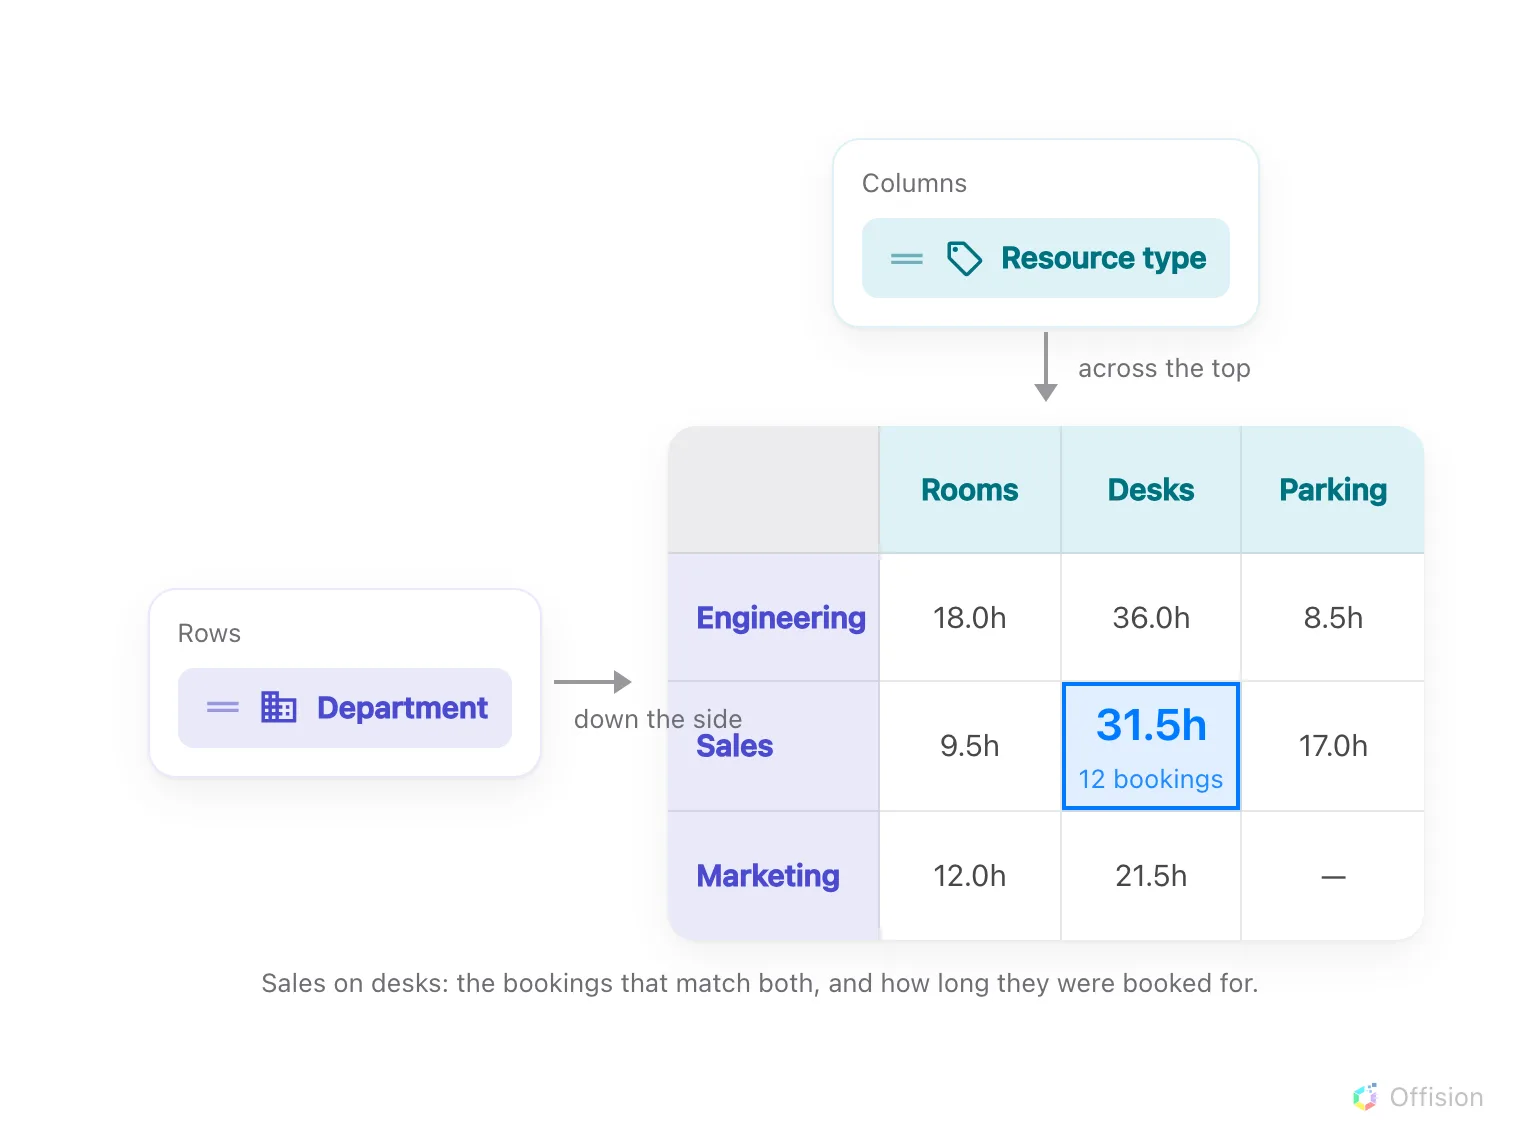
The field on Rows and the field on Columns decide what every cell counts: the bookings and hours that match both.
The fields come in four groups:
| Group | Fields |
|---|---|
| People | User (the organizer), Department, User group, and one entry per user-group category you have defined |
| Resource | Resource type, Category, Location, Resource |
| Booking form | One entry per booking-form field that can be pivoted on |
| Time | Week, Month |
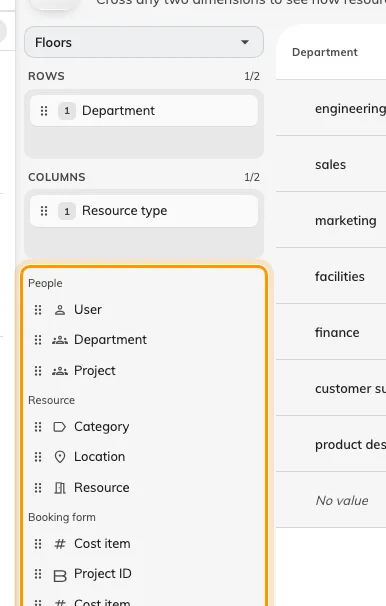
Everything not already on an axis, grouped. Department has left the list — it is on Rows.
It opens on User down the side and Resource type across the top.
A field appears here under the name you gave it, which is how the same word can appear twice: the Department on a person’s record and a user-group category you happened to call Department are different fields, and they group differently.
Three rules are worth knowing, because the screen enforces them silently:
- Two levels per axis, no more. Drop a third field on a full tray and it
springs back — the tray does not resize and nothing is said. The counter beside
the label reads
2/2when it is full. - A field can only be on one axis. Placing it removes it from the list.
- An axis is never empty. The last field on an axis cannot be removed.
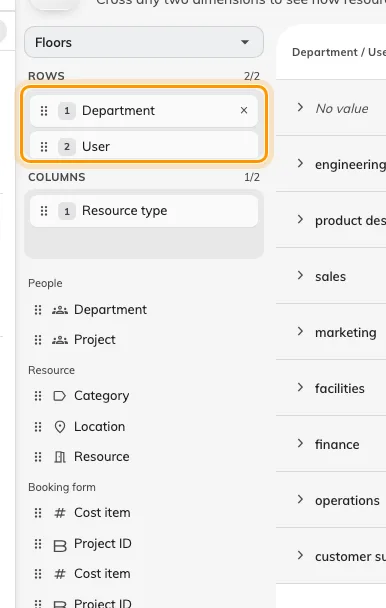
Two levels on Rows: departments, and the people inside each one.
Reading a large report
The grid shows at most 50 rows by 50 columns at a time. When there is more:
- A strip below the grid reads Rows 1–50 of 12,431 and Columns 1–50 of 312, each with arrows. Columns are ordered biggest first, so the second page never reshuffles the first.
- Expanding a row that has many children adds a Show 50 more line beneath it, with a count of how many of them are loaded.
- Changing either page collapses whatever you had expanded, because those cells belonged to the previous window.
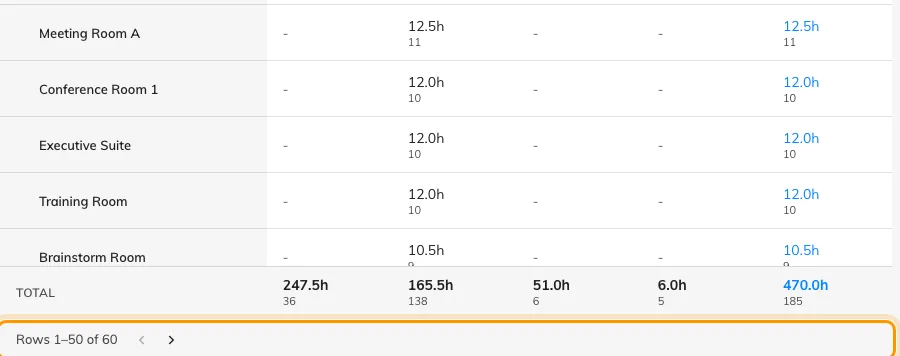
Resource down the side, and the strip that pages through it.
The totals stay true while the grid is partial. A row’s Total is that row’s total across every column, not just the visible ones, and the footer totals are whole-axis figures. So a page of the grid never adds up to its own total, and that is correct.
Open a cell
Click any cell — or a row’s Total — to see the bookings behind it, grouped by day, with tiles for the period, the number of bookings, the total hours and, when there are any, no-shows. Export in that dialog writes what the dialog is showing to a spreadsheet.
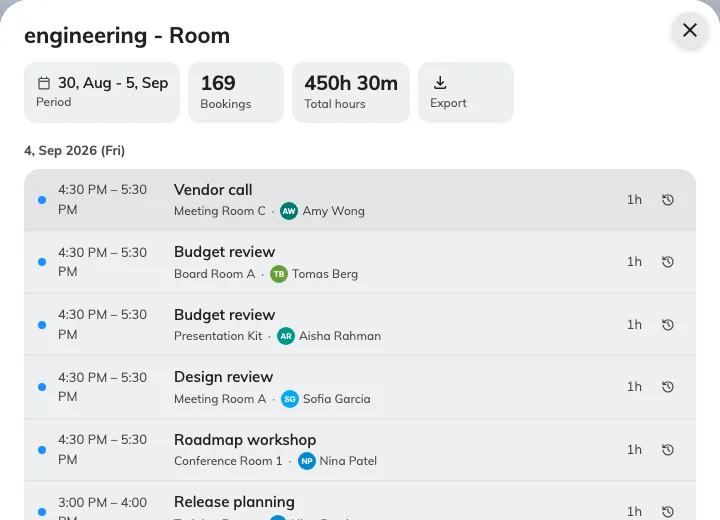
The bookings behind one cell, day by day.
Download
Download produces a spreadsheet with two sheets: Pivot, laid out like the screen, and Raw data, one flat row per combination — the shape to feed into Excel’s own PivotTable.
The file is much wider and deeper than the screen: it walks the axes past the 50×50 window. It is not unlimited, though — it stops at 200 keys on each axis, with no marker in the file to say so. On a report bigger than that, narrow the period or the floor filter rather than trusting the file to be complete — or take the figures from the reporting API, which has neither the 200-key cap nor the one-year window below.
Limits
- A period longer than a year is refused. The picker simply will not let you apply it — Apply greys out beyond 366 days. If it is ever refused after the fact the page says “Period is over 1 year. Shorten it or add a floor filter.”
- A very large report is refused too, with “Report too large. Narrow the period or filters.”
- A new booking takes a few minutes to appear. The figures are cached for about three minutes.
What this does not control
- Quota. How much somebody is allowed to book is a different screen — Quota usage history.
- Whether anyone turned up. Usage is booked time; attendance is check-in and no-show reporting.
- Occupancy. Sensor-measured occupancy is not what this counts.