

Get last quarter's usage for every room
Pull a quarter-end report of every room — bookings, booked hours and usage rate, one row per room — by picking Last quarter on Resource usage analytics and exporting the Resource ranking. Also how to split the quarter by department, export every booking behind it, and have a Quarterly summary email arrive on its own after each quarter closes.
A quarter-end room report is one export: Resource usage analytics, period Last quarter, the Rooms tab, then Export on the Resource ranking card. The file has one row per room — every room, including the ones nobody booked — with its bookings, booked hours and usage rate.
Three other places answer the questions that usually follow:
| You need | Open | You get |
|---|---|---|
| Every room’s bookings, hours and usage rate | Resource usage analytics › Resource ranking › Export | One row per room |
| The quarter split by department or person | User resource usage | A grid you build, rows against columns |
| Every booking behind the numbers | Calendar › Export, grain Quarterly | One row per booking, or per room per booking |
| The same quarter in an inbox, every quarter | Email report › Booking record summary, Quarterly | A summary email with a PDF and a spreadsheet |
1. Pick Last quarter
Open Booking › Analytics › Resource usage analytics, and choose the period beside the title.
Open Resource usage analyticsLast quarter and This quarter sit under Last 30 days. Quarters are calendar quarters: January–March, April–June, July–September and October–December. Last quarter is the whole quarter before today’s, so on 23 September it is 1 April to 30 June. This quarter runs to the end of the current one and includes the days still ahead.
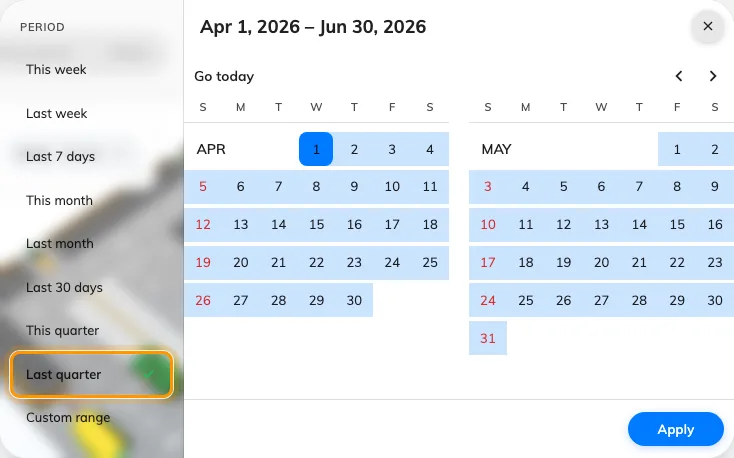
Last quarter in the period picker, under Last 30 days; the calendar on the right shows the dates it covers.
The same two presets are on every page that uses this picker: User resource usage, No-show analytics, Reports and the booking dashboard among them.
2. Choose Rooms, and what “used” means
Pick the Rooms tab. Overall mixes rooms with desks, parking and equipment, and a desk’s usage rate says nothing about a meeting room’s.
Then choose Business hours or 24 × 7. Business hours divides each room’s booked time by the hours it was open. Quote that one. 24 × 7 divides by every hour of the quarter, nights included, so every room looks quiet. What a room’s usage rate counts has the arithmetic.

The Rooms tab, beside Business hours or 24 × 7 and the period.
3. Export the Resource ranking
Scroll to Resource ranking. The card shows the top ten, but Export writes every room. Rooms with no bookings are in the file too, at zero, and those are often the finding.
The sheet has five columns: Rank, Resource, Bookings, Hours and Usage rate. Rows are sorted by bookings. Hours and Usage rate follow the Business hours / 24 × 7 choice at the moment you export, so a file you send on has to say which one it used.
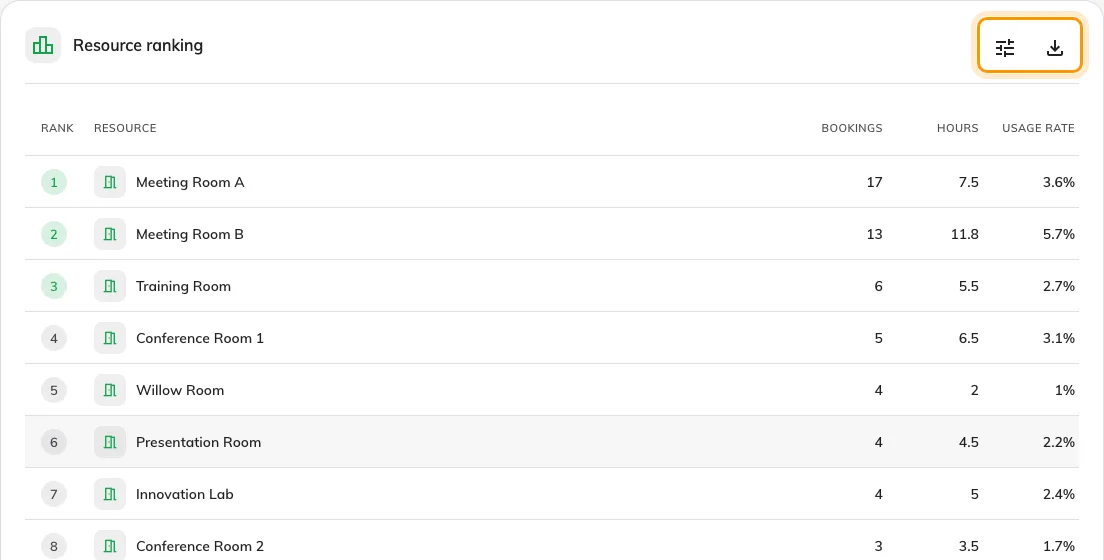
Resource ranking on the Rooms tab. Export writes every room, not only the ten shown.
4. Split it by department
For “which department used which rooms last quarter”, open User resource usage, pick Last quarter, and put Department down the side and Resource or Resource type across the top. It takes any period up to a year, so a quarter, or four of them side by side, fits. See how much your rooms are used walks through building the grid and downloading it.
Open User resource usage5. Export every booking behind it
For the bookings themselves, not totals, open Export on the booking Calendar, choose the Quarterly grain and then Last quarter. Next quarter is there too, for handing someone the list of what is coming. With Group by set to Resource, a meeting that held three rooms is three rows, which is the shape for room-by-room reconciliation. Export the bookings you are looking at covers the columns and formats.
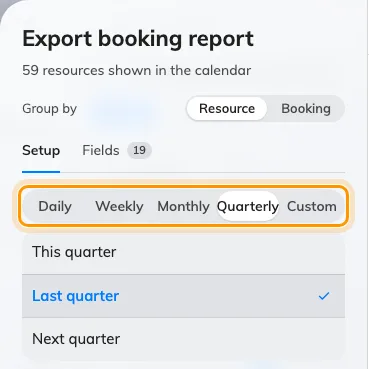
The booking export on the Quarterly grain, with This, Last and Next quarter under it.
6. Have it arrive every quarter
On Booking › Email report, add a Booking record summary and choose Quarterly on its card. Then pick a Day of month, 1 to 28. The report goes out on that day of January, April, July and October.
Open Email report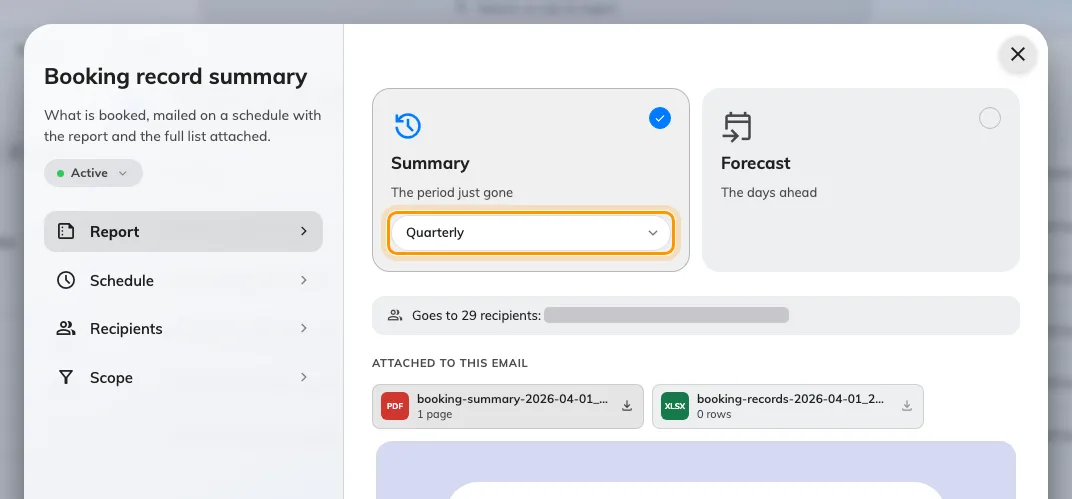
Quarterly chosen on the Summary card. The forecast does not offer it.
A quarterly summary always covers the last full calendar quarter, whichever day it goes out. A send on 3 October covers 1 July to 30 September, and so does a Send now on 15 November. Picking the 3rd rather than the 1st gives late bookings and check-ins a couple of days to settle before the figures are taken.
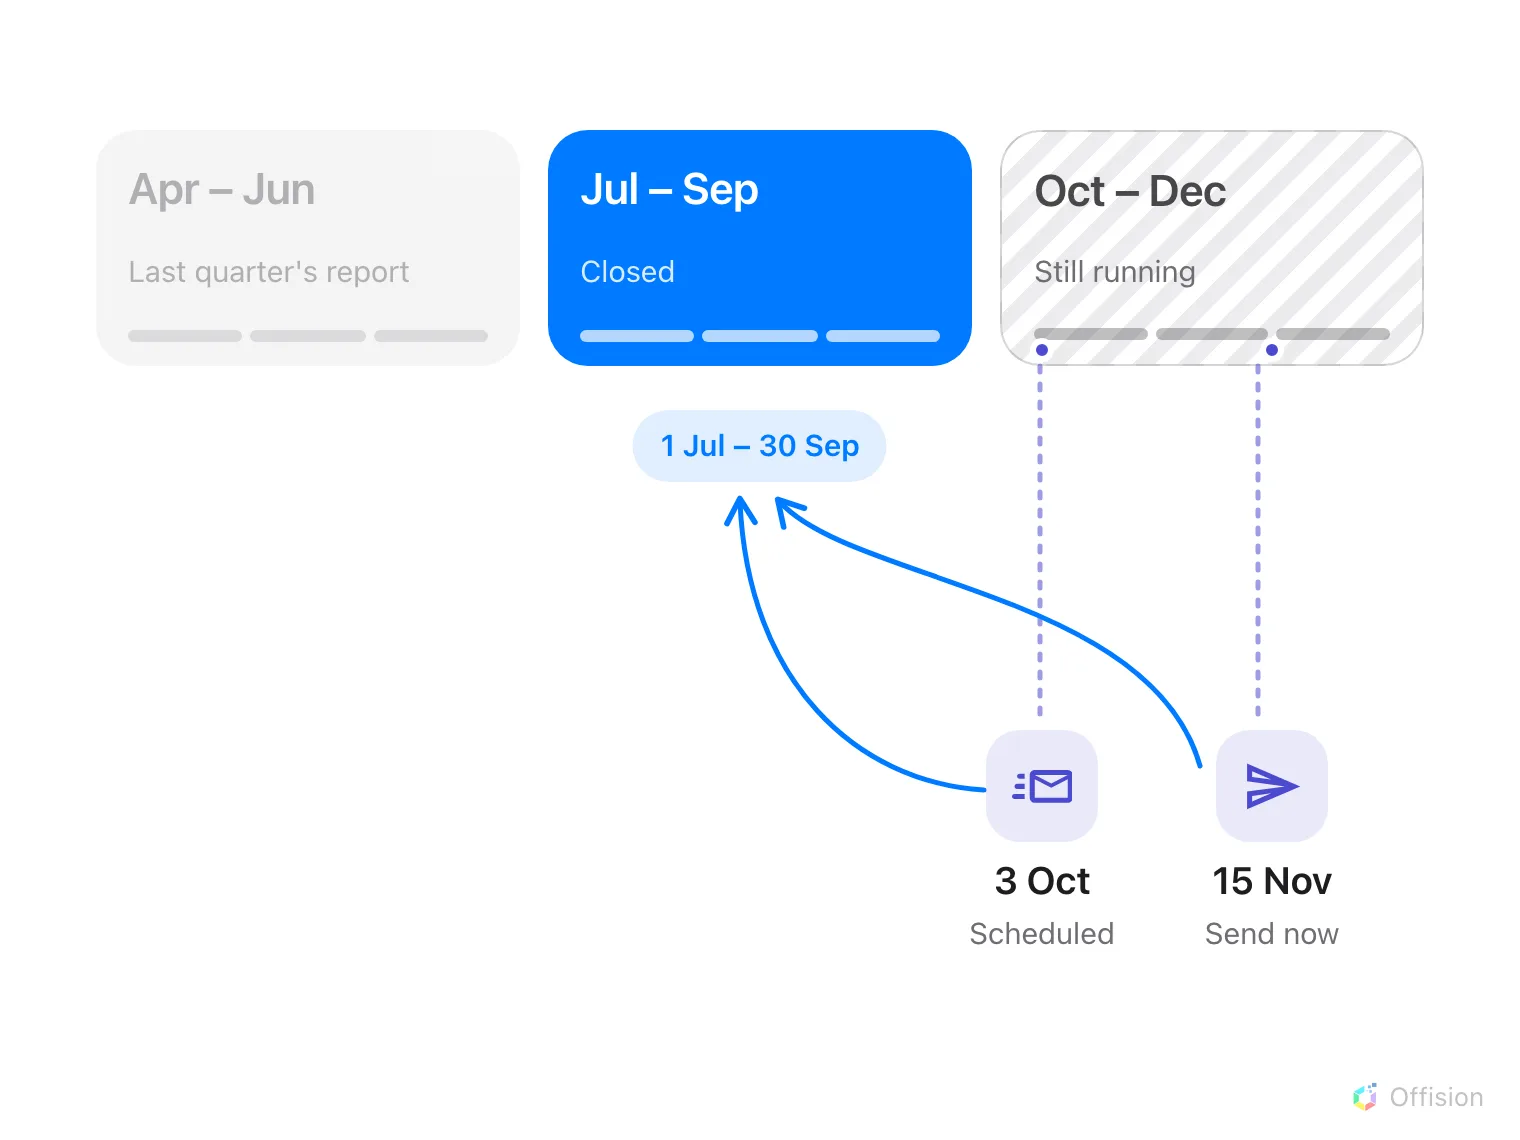
Whenever it is sent, a quarterly summary reports the quarter that has just closed.
Schedule lists the next four sends and the quarter each one reports on. Check it before you save.
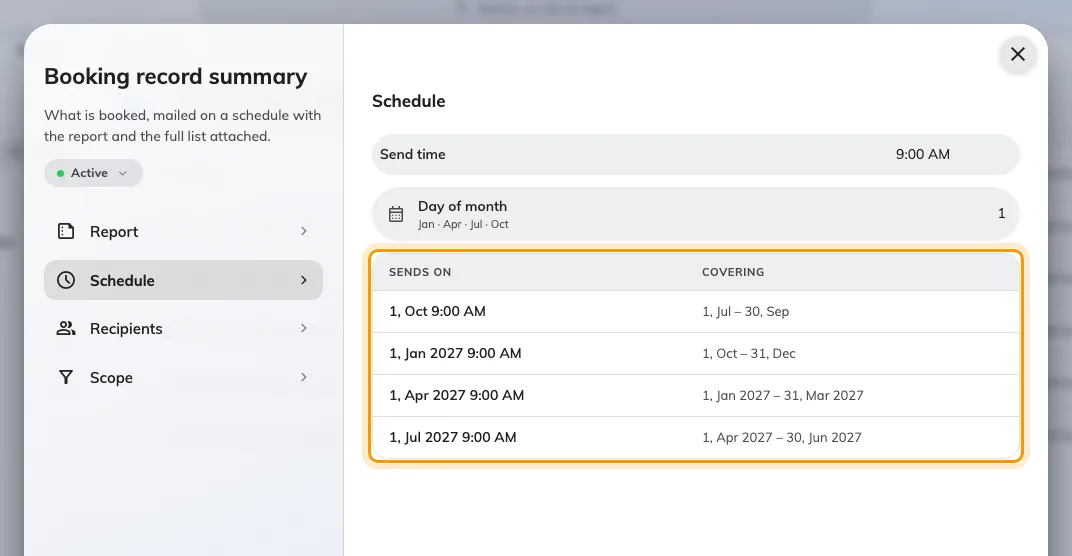
Four quarterly sends, each with the calendar quarter it covers.
The email counts the quarter’s bookings: the busiest rooms, the top organizers and how many were never checked in. It attaches a one-page PDF and a spreadsheet of every booking. It does not calculate a usage rate per room. That is the export in step 3. Email your managers a summary of past bookings covers recipients, scope and what arrives.
Check it worked
Open the exported sheet and find a room you know well. Its Bookings figure should match the ranking card on screen for the same period. If a busy room shows a low Usage rate in Business hours, its business hours are probably wider than the hours anybody books it for. That is a real finding, not a broken report.
What this does not tell you
- Whether anybody was in the room. Every figure is booked time. A room booked all quarter and never entered looks the same as one in constant use. Where rooms count people, Check whether the room was actually full has the measured numbers.
- A fiscal quarter. The presets and the email use calendar quarters. For a financial year that starts in April, choose Custom range in the picker and set the dates yourself. The email cannot follow a fiscal quarter; a Monthly summary is the nearest.
- A weekday breakdown. No report here totals usage by day of the week.
- One room’s hours across the quarter. The ranking gives one line per room. For the hour-by-hour shape of a single room, filter Booking analytics to it.