

See every device in one place
Find devices by location and connection state, inspect reported player, app and firmware versions, and monitor mapped rooms on Map 2.0 or Classic. Explains missing readings, columns, filters and device actions.
Device monitoring is the one screen that does not care what kind of hardware something is. Panels, signage screens, e-paper tags, door controllers, lockers, microphones, gateways and sensors all arrive in the same table, described in the same columns, and filtered the same way.
Two halves
The top half is where things are: a switch between Earth, city, building, floor and room, with a list on the left and a map, a stack of floors or a floor plan on the right. Choosing a place narrows the table underneath to what is in it.
The bottom half is the table.

Every kind of device in one table, scoped to the place chosen above it.
The page remembers where you left it, so a facilities manager who works one building lands there next time rather than on the globe.
The columns that answer the question
Status is either Online or Offline, and it is the live connection state — the same thing the offline alert watches, so a device the table calls offline is a device that will be emailed about once its threshold passes.
Last seen is how long ago the device was answering, written as a relative time with the exact moment on hover. It is the column that separates “the network blinked” from “this has been dead since Friday”.
Battery applies to devices that have one, e-paper tags especially, and shows a lightning mark when the device is plugged in instead. A tag that has gone quiet here is usually out of range rather than flat — see How fast Qbic e-paper tags update.
The rest describe the thing rather than its health: Name, Space, Floor, Building, Manufacturer, Model, IP address, and — hidden until you ask for them — MAC address, Serial number, Firmware, Browser version, App version and Type. Sorting / Columns chooses which appear and in what order, and remembers your choice.
Link opens the device’s own web interface, on its own network address. That only works from a computer on the same network as the device, which is why it asks before it opens.
Filtering happens in the headers
There is no toolbar. Each column header carries its own control: type a name, choose one or more device types, pick Online, Offline or Low battery, choose a floor or a building, choose a manufacturer. Combine them freely — Offline plus a building answers “what is broken here” in two clicks.
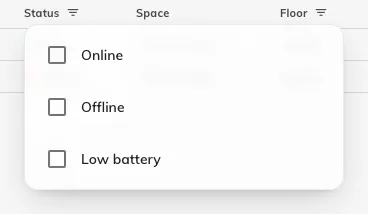
The Status filter: Online, Offline, or Low battery.
Clear filter on an active header drops just that one.
The detail beside it
Selecting a row opens the device on the right. What appears depends on what it is.
For a panel or a screen it is the device’s own record: Connection status, Device information, Network info, Hardware, System version, its Linked resource and its configuration — plus Real-time screen, which fetches a live screenshot, and Reboot. Both are greyed out while the device is offline, with Device is offline on hover, because there is nothing there to ask.
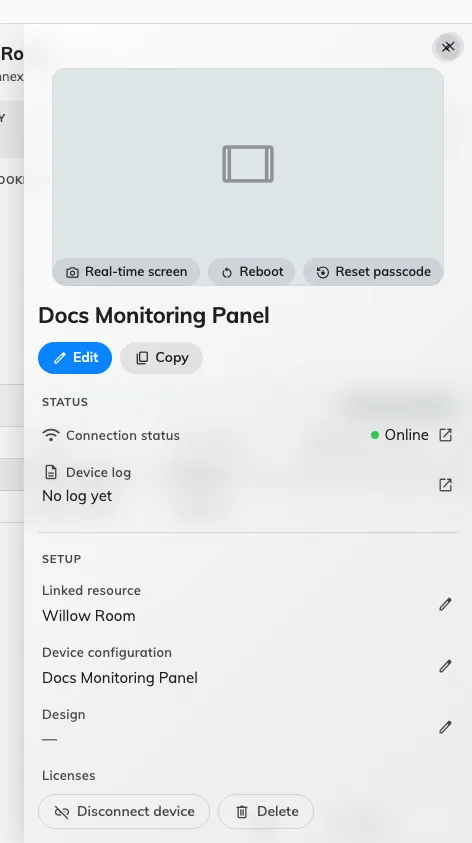
A device that is answering: its connection state at the top, and the two actions that need it live.
For a sensor it is the readings and a link to their history; for something with controls — a camera, a screen, a relay, a lock — it is those controls. For a gateway it is the devices hanging off it.
Deleting from here
The detail panel ends with Delete, so a device you have just found dead can be removed without going to find it on another page.
It is offered for IoT devices and gateways, and for players, which have always had it. Deleting a gateway takes its expansion units and their child devices with it, and a control processor says so before it goes. Doors, e-paper tags, microphones and locker boxes have no Delete here — those rows are a read-only view of a record that lives elsewhere, so they are deleted on their own pages.
Where this stops
This screen tells you a device is not answering. It does not tell anybody else — that is the offline alert — and it does not show you what a working screen is currently displaying, which is Screen monitoring.
Check the installed software
Open a paired panel or screen’s row in its device list and Edit. Hardware information shows the reported device model, operating system, Offision Version and Container version. Firmware appears only when the hardware reports it. For an Android app, the container version identifies the installed app package; it is separate from the web-player version and the device’s firmware. A blank value means the device has not supplied that reading, not that an update has succeeded.
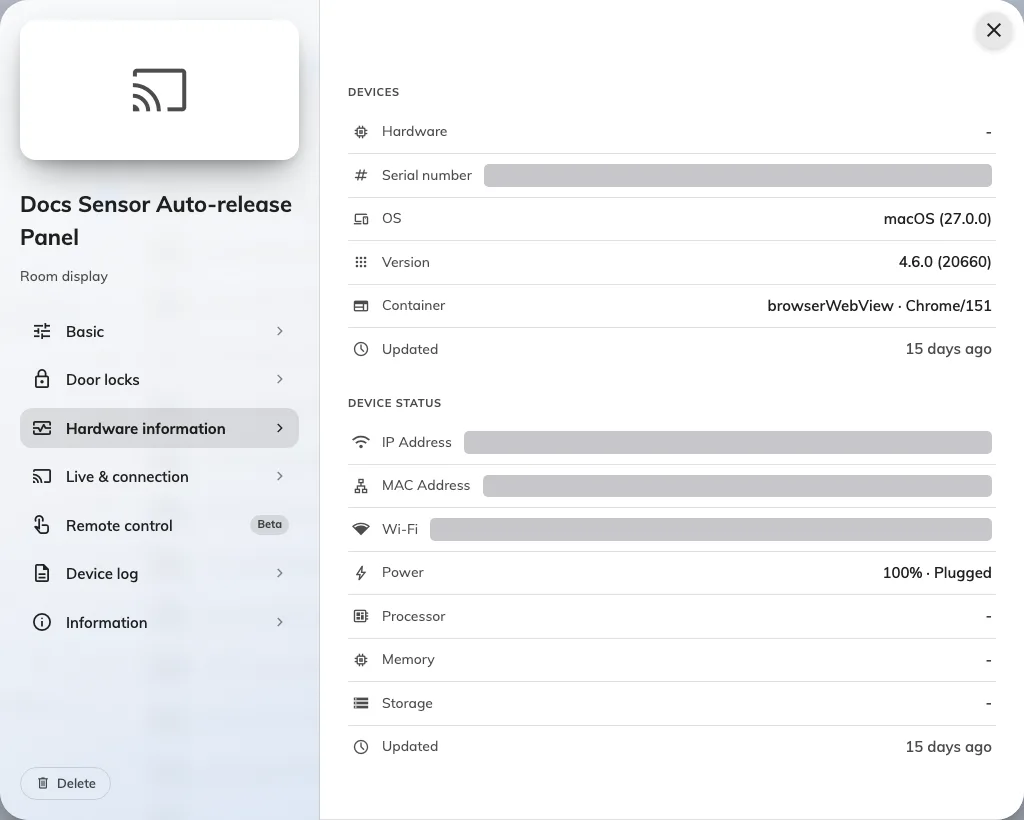
A browser-based panel reports the player and container separately.
Monitor a Map 2.0 floor
The floor view supports both Map 2.0 and Classic. With the new map enabled for the account, floors with a Map 2.0 scene use it and floors without one use Classic; editing a Classic drawing does not update a Map 2.0 scene. Assign the room resources on the map you use, then choose that floor in Device monitoring. Device type and manufacturer filters apply to the floor view as well as the table. Select a mapped room to narrow the device list to it.
If the floor or room is missing, check the selected map family and resource assignments before treating it as a disconnected device. See Where the map appears and Assign resources on Map 2.0.