

See how the programme is doing
Attendance and no-show rates, registrations, and the status breakdown — with a note on the one split the dashboard deliberately does not make.
The dashboard answers how the programme as a whole is going, rather than how one event went. It is where the question “are people actually turning up?” gets an answer with a number on it.
Open Dashboard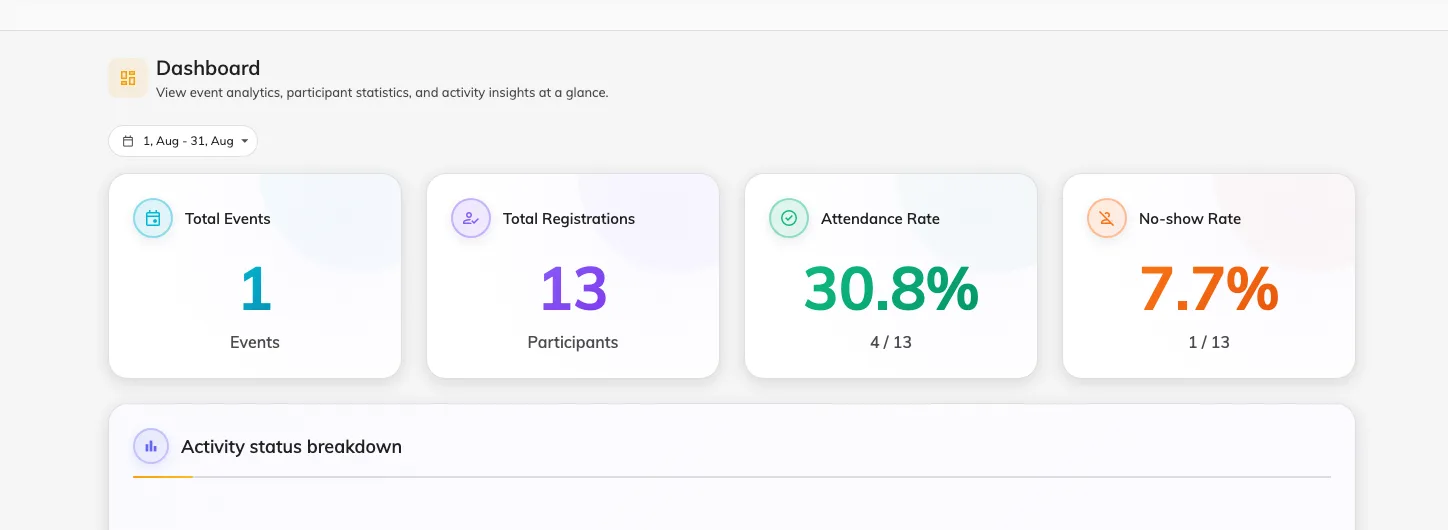
The four figures and the status breakdown. The range defaults to this month.
What each figure counts
| Figure | What it is |
|---|---|
| Total Events | How many events exist |
| Total Registrations | Every registration across them |
| Attendance Rate | The share of registrations that were checked in |
| No-show Rate | The share marked as not having turned up |
| Activity status breakdown | How the programme splits across draft, published, paused, closed and cancelled |
| Participants by category | Which kinds of event draw people |
| Upcoming events | What is coming next |
Two things to know before you quote a number
Attendance rate is only as good as your check-in. It counts people marked as attended, and that mark comes from somebody scanning at the door. An event nobody took attendance at reads as nobody having come — which looks like a catastrophic event and is really an unattended door.
The same applies in reverse to No-show rate: a no-show is a deliberate mark, not an absence of a scan. Events where nobody checked anybody in contribute neither.
What this page does not show
- Anything per event. For one event’s numbers, open the event.
- Capacity against registrations. How full something is belongs to the event.
- Email or pass delivery. Nothing here reports whether messages arrived.