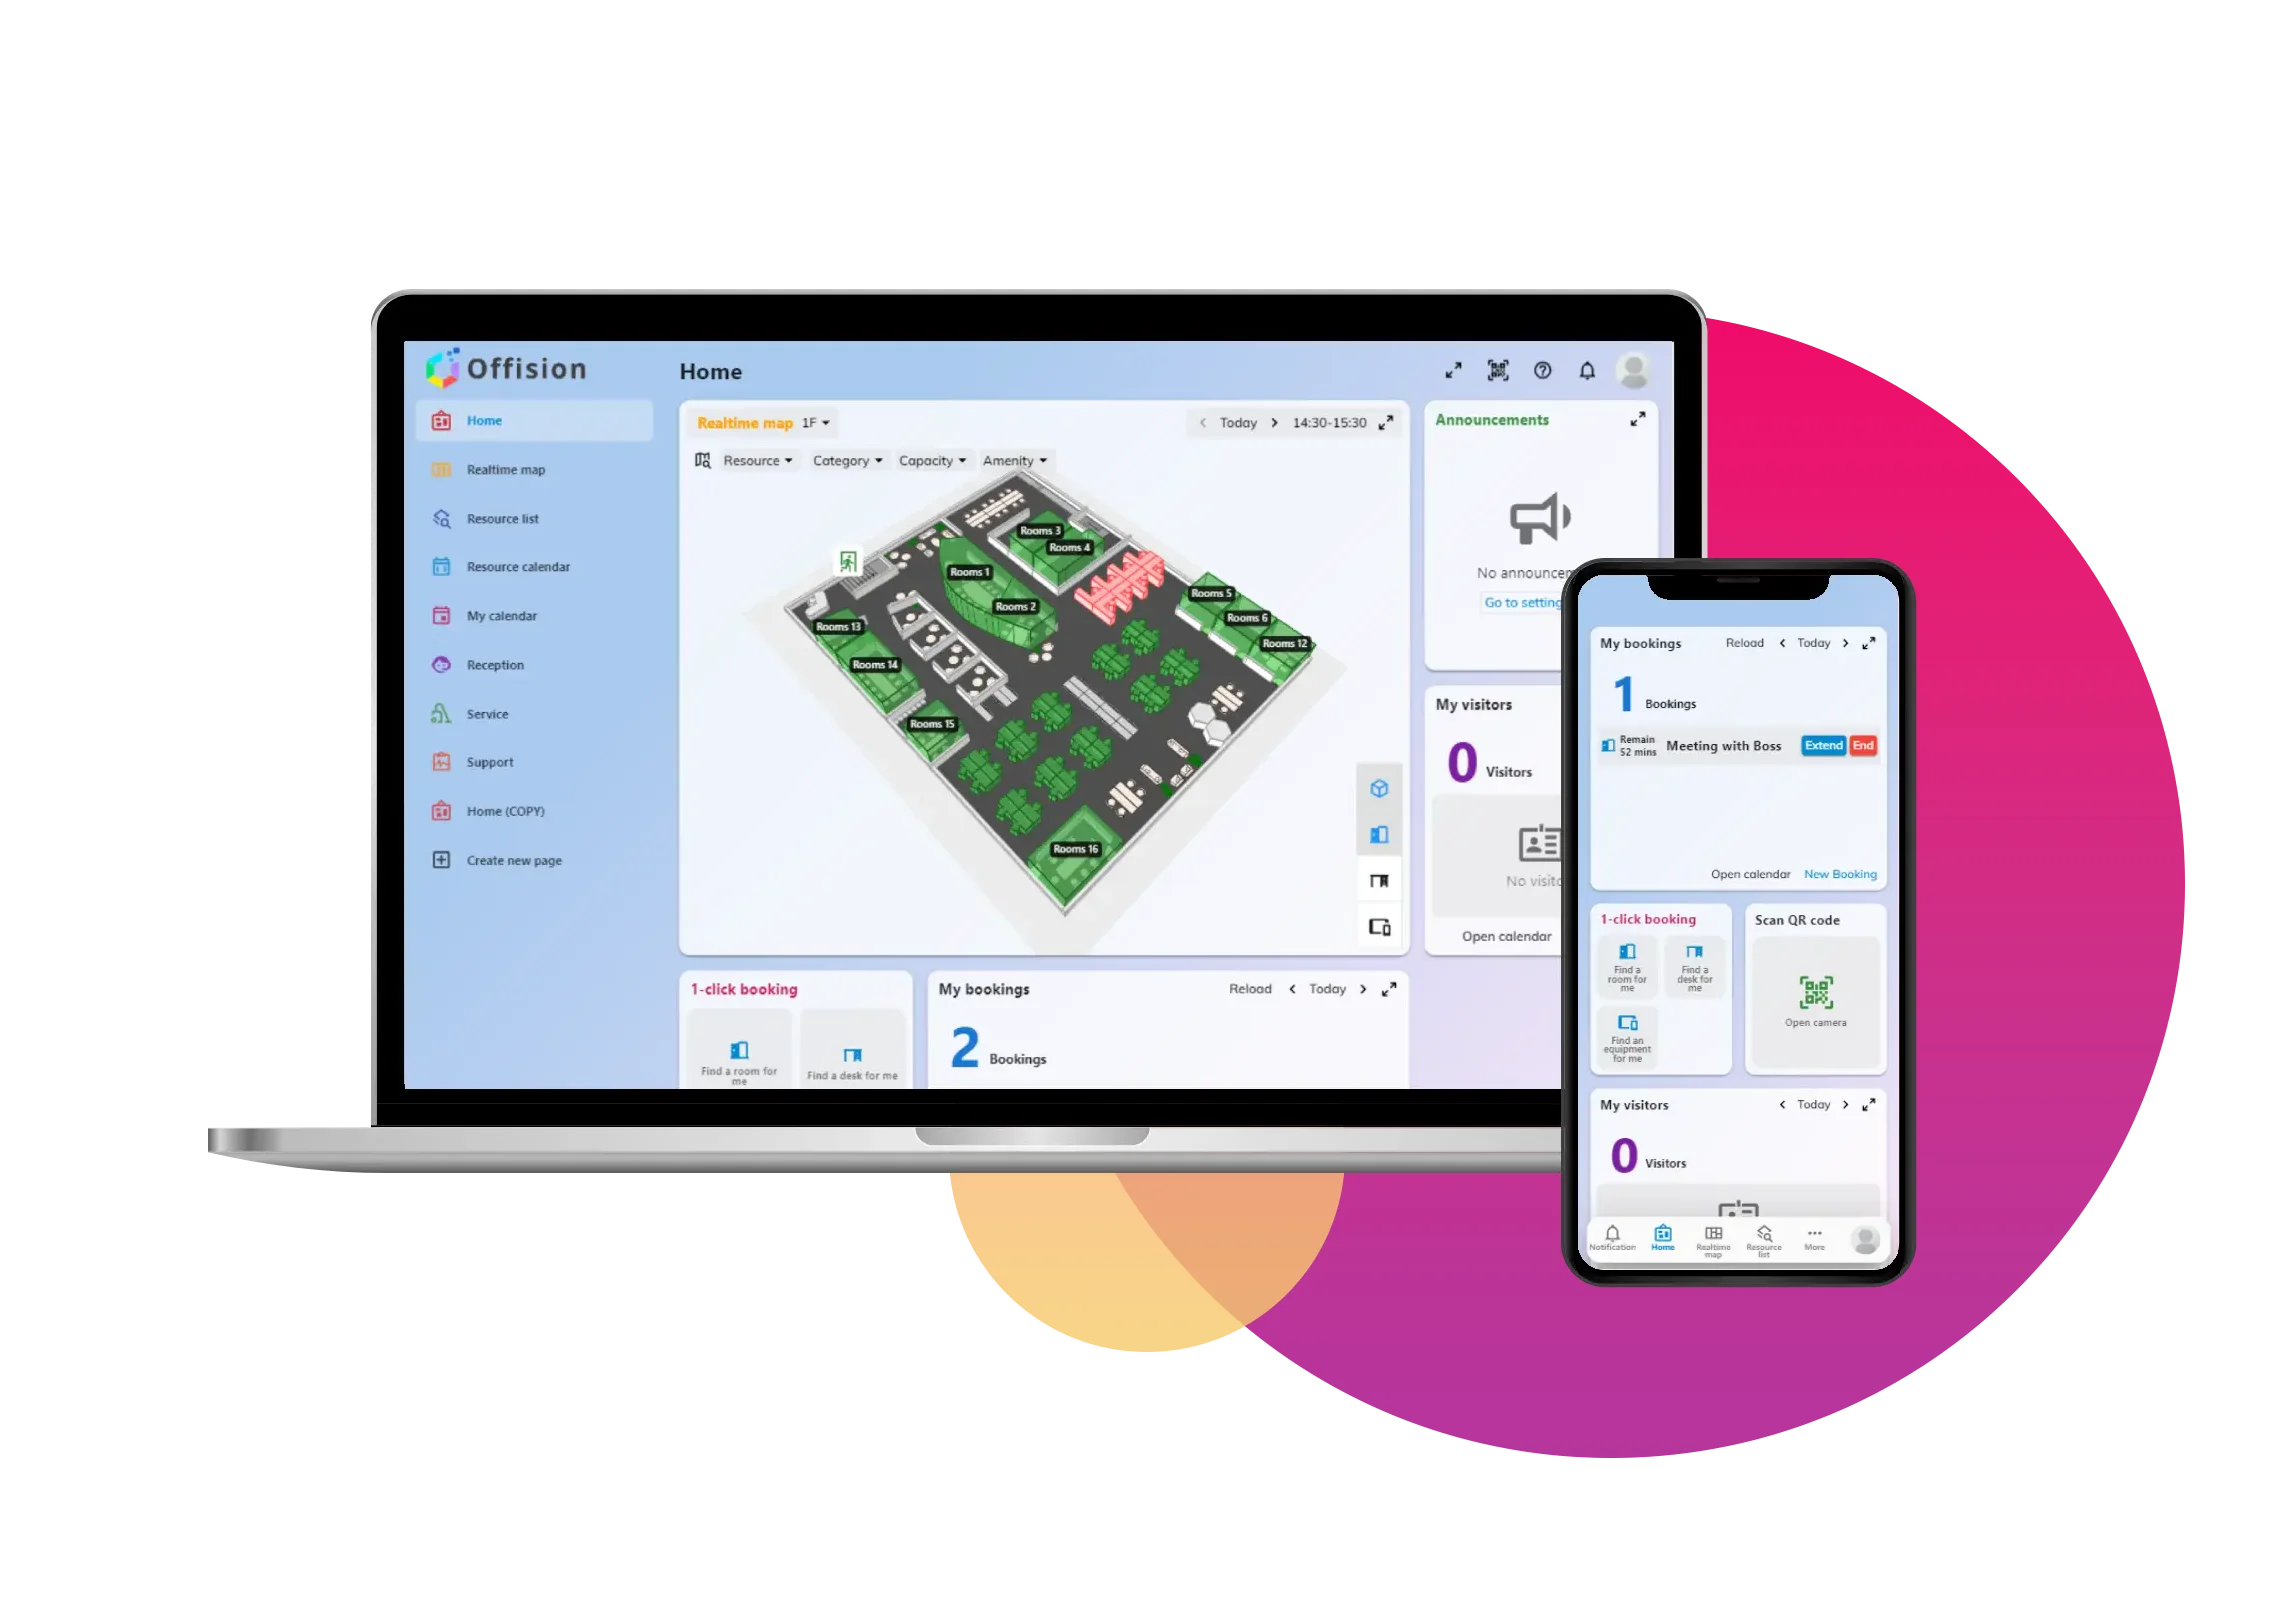
A 3D floor map displaying resource usage analytics, allowing users to compare the utilization of rooms, desks, and other spaces visually. Color-coded highlights and metrics indicate usage intensity for informed decision-making.
洞察與最佳實踐,協助您優化工作空間
Purpose:
The usage map helps workspace managers and decision-makers compare and optimize the performance of rooms and desks across a 3D floor plan, enhancing resource allocation and improving workspace efficiency.
Example Use Cases:
Performance Comparison:
Workspace administrators compare high-usage and low-usage areas on the map to identify resources that need better promotion or reallocation.
Layout Optimization:
A facilities manager uses the map to detect underused resources, such as meeting rooms that are too large or desks in undesirable locations, and adjusts the layout accordingly.
Resource Rebalancing:
The map helps organizations redistribute resources, such as converting underused rooms into hot desk areas or adding more spaces to meet high-demand areas.
Usage Trends Over Time:
Historical comparisons allow managers to track how usage patterns evolve, such as seasonal demand for specific rooms or desks, enabling better planning for future needs.
Capacity Planning:
By analyzing resource usage, a company can determine whether additional rooms, desks, or shared spaces are necessary to meet employee needs.
Hybrid Work Monitoring:
In a hybrid work model, the usage map helps evaluate how employees are utilizing the office, supporting decisions on desk hoteling or flexible work arrangements.
Energy Efficiency Improvements:
The map highlights overused or underused areas, helping facilities teams optimize lighting, heating, and cooling systems to align with actual usage patterns.
The 3D usage map is an essential tool for organizations looking to create a data-driven, efficient, and user-centric workspace, empowering them to make real-time and long-term improvements.
備受全球機構信賴
加入數百間使用 Offision 提升工作空間管理效率的企業
©2026 ONES Software Ltd. All rights reserved.