Analytics
This section will introduce the main function for data records and analytics, which includes analytics and report. These can help you to track down the system healthiness, resource usage and user behavior for your smart office environment.
Management console -> Analytics
Analytics is designed for administrators to overview the collected data on several aspects: (1) Resource Usage, (2) Service Usage, (3) User Usage, (4) Building Usage.
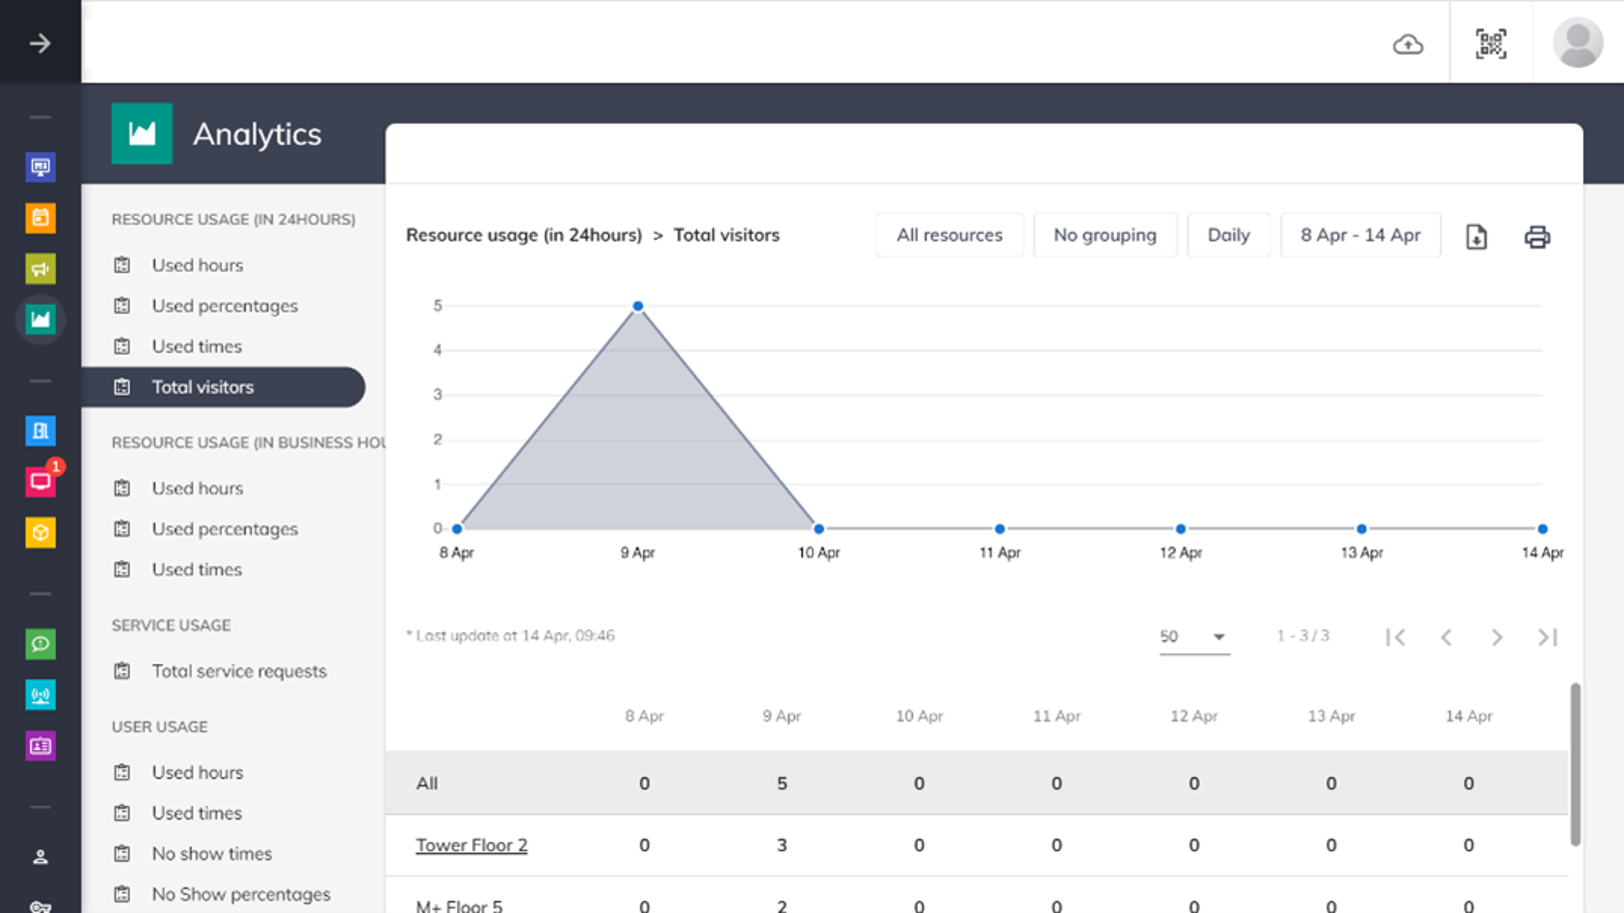
Resource Usage: administrators can view the resource usage data related to used hours / used percentage / used times / total visitors in either 24 hours or business hours.
Service Usage: users can request services when they reserve a meeting room. The system will show the total request at certain period.
User Usage: administrators not only can view the used hours / times for resource of each user, but can also view the no show rate andtotal visitors invited by users at certain period.
Building Usage: administrators can view the number of visited / no show visitors in a building / venue.
Extra functions

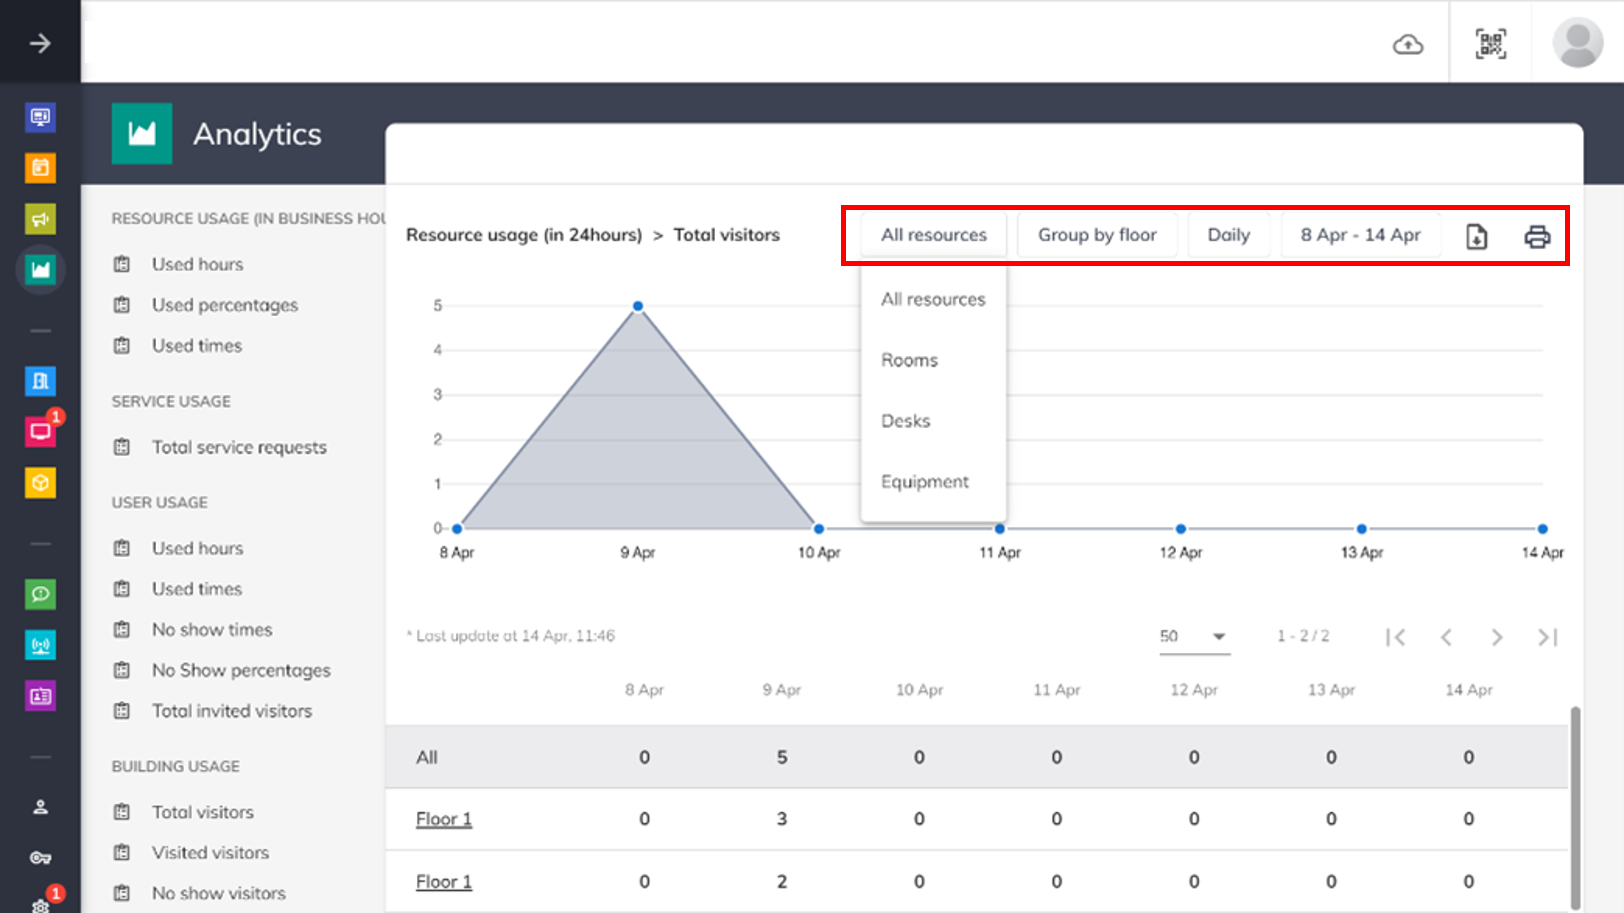
Filter by resources: to show how many visitors used the rooms / desks / equipment.
Filter by grouping: to show the report by floor / building / amenity.
Filter by period: to show the data at certain period of time.
Export Excel report: you can select the file format of Excel(.xlsx, .xls) and CSV. You can download the report based on different aspects for your record.

Sample report of resource usage Print report: you can preview the report in PDF format and print the report.