
This first release of the Offision Asia Hybrid Occupancy & Tool-Sprawl Index looks at how full offices are across Asia, and how scattered the tools around them have become.
Why an Asia-first view matters
Many widely cited workplace reports, including those from Appspace and Eptura, are built mainly on US and UK samples. They are useful. They are the wrong default for Asia.
Office habits, return-to-office rules, and the tools people use are not the same from Singapore to London. Facilities, workplace, IT, and real-estate teams here need a regional starting point: how full the offices actually are, and how fragmented the tools around them have become.
The headline numbers
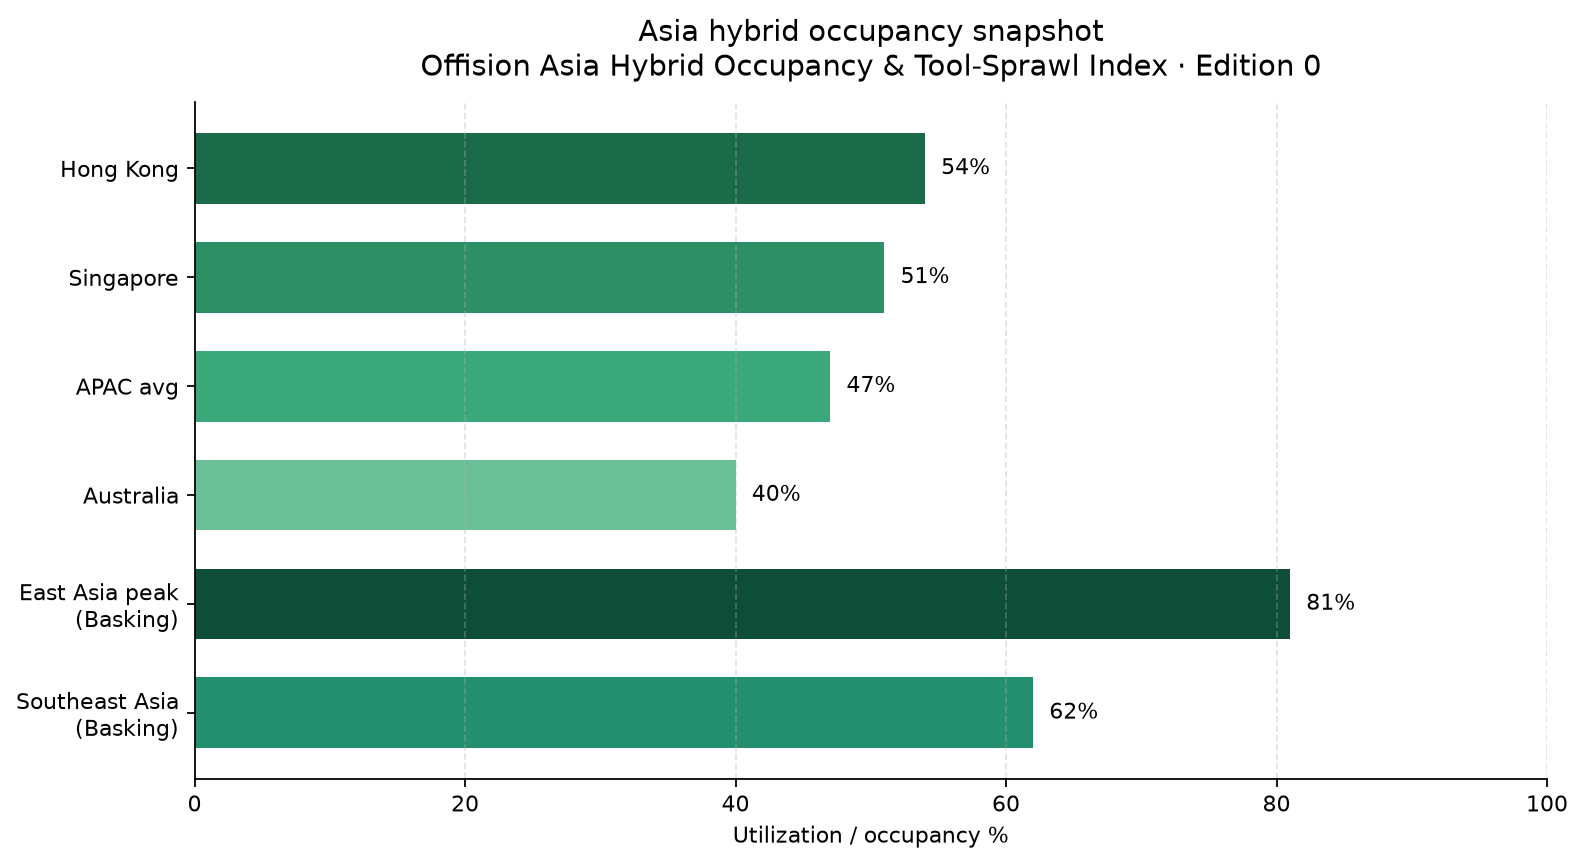
- APAC office utilization averaged 47% in XY Sense Q2–Q3 2025 readings, with Hong Kong at 54% and Singapore at 51%.
- About 71% of organizations in APAC are under a return-to-office mandate, according to JLL 2025 research.
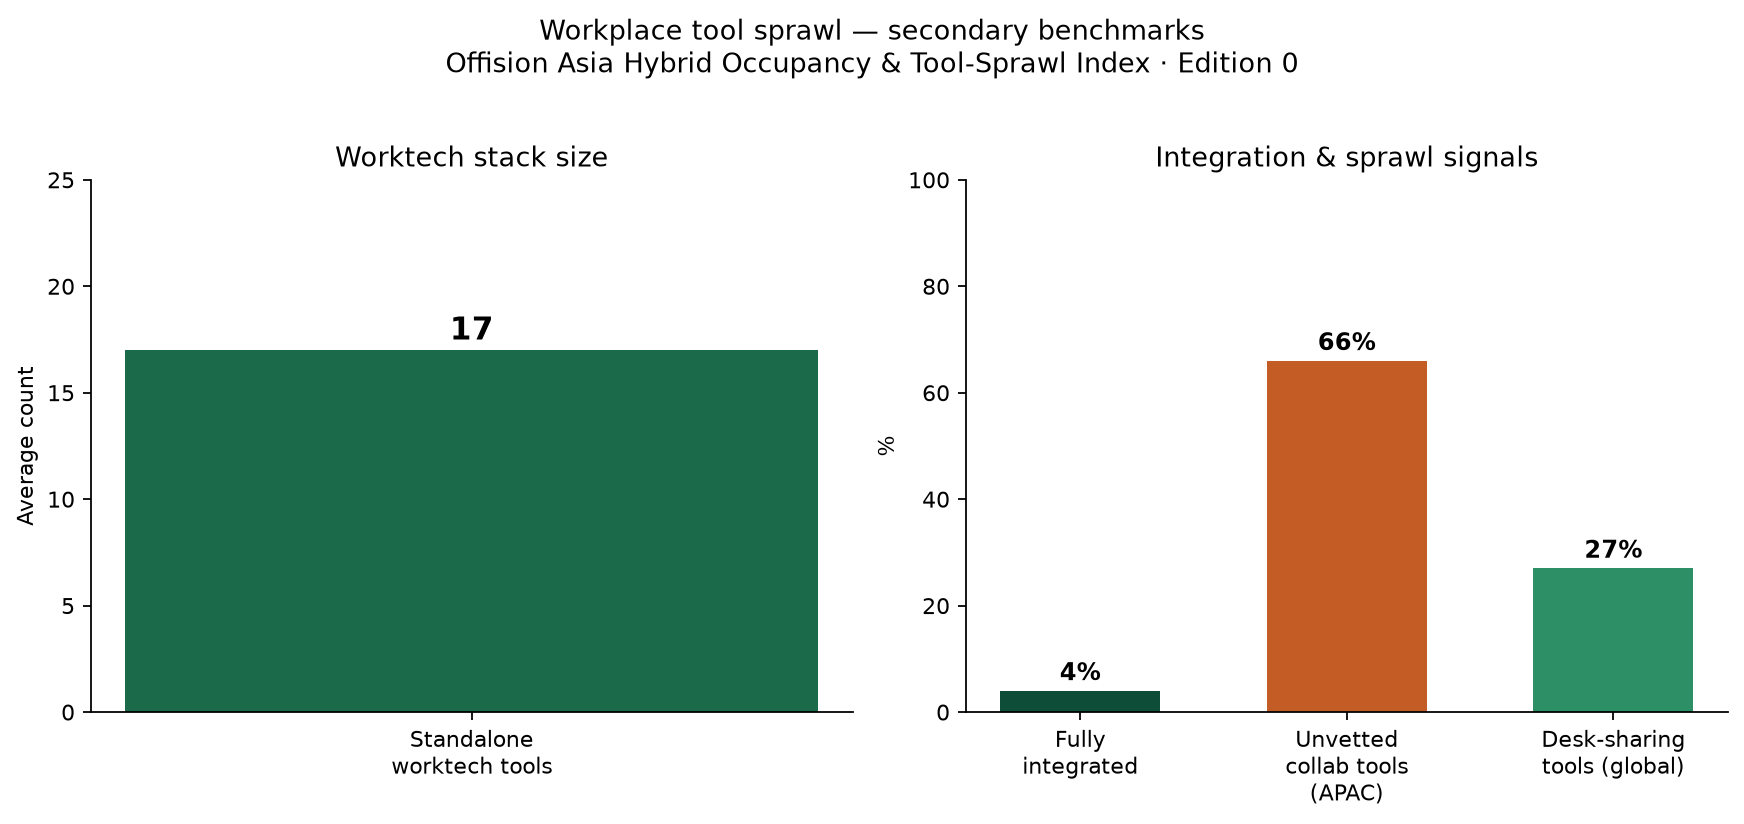
- The typical organization runs about 17 standalone worktech tools, and only 4% describe the stack as fully integrated (Eptura, 2025).
- 66% of APAC organizations are using unvetted collaboration tools (Mimecast).
- 88% of APAC organizations have people in the office three or more days a week (CBRE, 2026).
Averages hide the busy days
A 47% APAC utilization average is not an empty-office story. It is also not one number you can plan to.
XY Sense Q2–Q3 2025 figures already split the region: Hong Kong at 54% and Singapore at 51%, both above the APAC average. The chart also places Australia at 40% average utilization. That is a different operating problem from Hong Kong, on the same picture.
Peak days are busier still. Basking peak-day readings, plotted on the same chart, put East Asia at 81% and Southeast Asia at 62%. An office that looks half-used across the week can be effectively full on the days that matter for desks, rooms, and building services.
Policy is bringing people in, not sending them home. JLL 2025 research finds about 71% of APAC organizations under a return-to-office mandate. CBRE’s 2026 view is that 88% of APAC organizations have employees on site three or more days a week.
The planning question in Asia is not whether anyone will come back. It is which days they come, which city you are in, and whether the workplace can absorb the peak without the weekly average misleading you.
Seventeen tools, almost no shared picture
Knowing who is in the office only helps if the systems that record it, book the desk, and tell people where to go agree with each other. They usually do not.
Eptura 2025 research puts the average stack at about 17 standalone worktech tools, with only 4% of organizations fully integrated. Booking, sensors, visitor management, room panels, analytics, and the collaboration suite each keep their own version of the day.
The risk is not only a clumsy day at work. Mimecast finds that 66% of APAC organizations are using collaboration tools that were never vetted. Unapproved chat, file, and meeting tools sit beside the official set of systems. That is a security problem as well as an occupancy problem.
The chart also includes a global figure from published research: 27% of organizations use a desk-sharing tool. That is still a minority, even as three-day office weeks become the norm.
What this means for your workplace
Plan for the busy days, not a single occupancy target. A weekly average of 47% and a peak day of 81% cannot be served by the same desk ratio. Plan neighborhood capacity, room supply, and visitor load for the busy days, and treat the average as context. CBRE’s 88% at three or more days a week is the attendance pattern. The XY Sense city splits are the utilization pattern. Both belong in the plan.
Bring the tools together. Seventeen standalone tools, and only 4% of organizations fully integrated, is why the occupancy number is hard to trust. Each extra tool is another login, another dataset, and another place for an unapproved workaround. Fewer systems that share one picture — who is in, which space is free, and which visit is expected — will do more than adding another tool on top of the 17.
Put the stack in one place. If you want planned flexibility without tool sprawl — desk and room booking, presence clarity, and a simpler workplace stack that works for Asia teams — see how Offision brings that into one place.
Sources
- XY Sense, workplace utilization, Q2–Q3 2025. APAC average utilization 47%; Hong Kong 54%; Singapore 51%. xysense.com
- JLL, 2025. About 71% of APAC organizations under a return-to-office mandate. jll.com
- Eptura, 2025. About 17 standalone worktech tools; only 4% of organizations fully integrated. eptura.com
- Mimecast. 66% of APAC organizations using unvetted collaboration tools. mimecast.com
- CBRE, 2026. 88% of APAC organizations in the office three or more days a week. cbre.com
- Basking. Peak-day occupancy as plotted on the chart: East Asia 81%, Southeast Asia 62%. basking.io
- Appspace. Referenced as a US/UK-weighted workplace-index publisher, for contrast with an Asia-first view. appspace.com
- Australia at 40% average utilization, and desk-sharing tools at 27% globally, appear on the charts. Australia is shown with the utilization series; the desk-sharing bar is not separately labeled with a publisher on the graphic. They are drawn from published research in this release, not from an Offision survey.
Leave a Reply